Dear,
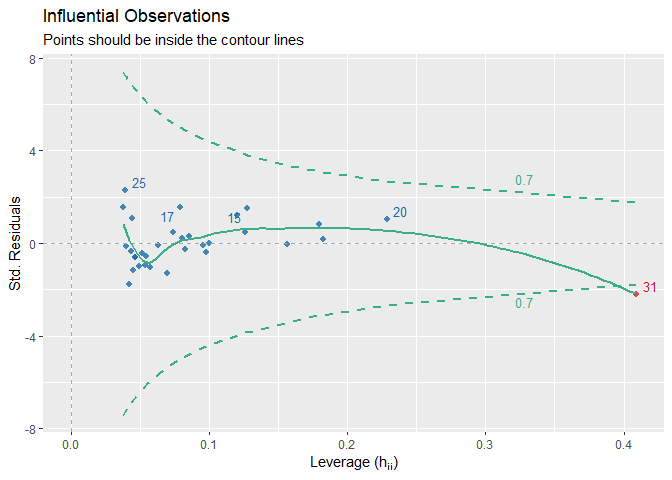
I noticed that the contour lines of the critical Cook's distance function are not changing when the user supplies a new threshold value. The detected outliers in the object and the plot no longer match for different thresholds. The following reprex displays the issue. Can you explain me why that is? Thanks!
Kind regards
library(performance)

model <- lm(disp ~ mpg + hp, data = mtcars)

# default threshold
outliers <- check_outliers(model, method = "cook")
print(outliers)
#> 1 outlier detected: case 31.
#> - Based on the following method and threshold: cook (0.808).
#> - For variable: (Whole model).
plot(outliers)
# increasing the threshold gives no more outliers, but the plot remains the same
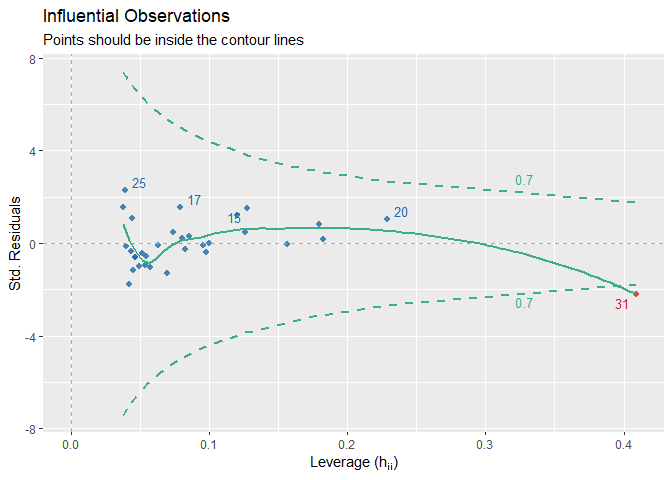
outliers2 <- check_outliers(model, method = "cook", threshold = list(cook = 2))
print(outliers2) # this gets adapted based on the new threshold
#> OK: No outliers detected.
#> - Based on the following method and threshold: cook (2).
#> - For variable: (Whole model)
plot(outliers2) # the contour lines stay the same
Created on 2026-06-22 with reprex v2.1.1
Session info
sessioninfo::session_info()
#> ─ Session info ───────────────────────────────────────────────────────────────
#>  setting  value
#>  version  R version 4.6.0 (2026-04-24 ucrt)
#>  os       Windows 11 x64 (build 26200)
#>  system   x86_64, mingw32
#>  ui       RTerm
#>  language (EN)
#>  collate  Dutch_Belgium.utf8
#>  ctype    Dutch_Belgium.utf8
#>  tz       Europe/Brussels
#>  date     2026-06-22
#>  pandoc   3.8.3 @ C:/Program Files/RStudio/resources/app/bin/quarto/bin/tools/ (via rmarkdown)
#>  quarto   1.9.36 @ C:\\PROGRA~1\\RStudio\\RESOUR~1\\app\\bin\\quarto\\bin\\quarto.exe
#>
#> ─ Packages ───────────────────────────────────────────────────────────────────
#>  package      * version   date (UTC) lib source
#>  cli            3.6.6     2026-04-09 [1] CRAN (R 4.6.0)
#>  curl           7.1.0     2026-04-22 [1] CRAN (R 4.6.0)
#>  datawizard     1.3.1     2026-04-26 [1] CRAN (R 4.6.0)
#>  digest         0.6.39    2025-11-19 [1] CRAN (R 4.6.0)
#>  dplyr          1.2.1     2026-04-03 [1] CRAN (R 4.6.0)
#>  evaluate       1.0.5     2025-08-27 [1] CRAN (R 4.6.0)
#>  farver         2.1.2     2024-05-13 [1] CRAN (R 4.6.0)
#>  fastmap        1.2.0     2024-05-15 [1] CRAN (R 4.6.0)
#>  fs             2.1.0     2026-04-18 [1] CRAN (R 4.6.0)
#>  generics       0.1.4     2025-05-09 [1] CRAN (R 4.6.0)
#>  ggplot2        4.0.3     2026-04-22 [1] CRAN (R 4.6.0)
#>  ggrepel        0.9.8     2026-03-17 [1] CRAN (R 4.6.0)
#>  glue           1.8.1     2026-04-17 [1] CRAN (R 4.6.0)
#>  gtable         0.3.6     2024-10-25 [1] CRAN (R 4.6.0)
#>  htmltools      0.5.9     2025-12-04 [1] CRAN (R 4.6.0)
#>  insight        1.5.1     2026-05-21 [1] CRAN (R 4.6.0)
#>  knitr          1.51      2025-12-20 [1] CRAN (R 4.6.0)
#>  labeling       0.4.3     2023-08-29 [1] CRAN (R 4.6.0)
#>  lattice        0.22-9    2026-02-09 [2] CRAN (R 4.6.0)
#>  lifecycle      1.0.5     2026-01-08 [1] CRAN (R 4.6.0)
#>  magrittr       2.0.5     2026-04-04 [1] CRAN (R 4.6.0)
#>  Matrix         1.7-5     2026-03-21 [2] CRAN (R 4.6.0)
#>  mgcv           1.9-4     2025-11-07 [2] CRAN (R 4.6.0)
#>  nlme           3.1-169   2026-03-27 [2] CRAN (R 4.6.0)
#>  otel           0.2.0     2025-08-29 [1] CRAN (R 4.6.0)
#>  performance  * 0.17.0    2026-05-21 [1] CRAN (R 4.6.0)
#>  pillar         1.11.1    2025-09-17 [1] CRAN (R 4.6.0)
#>  pkgconfig      2.0.3     2019-09-22 [1] CRAN (R 4.6.0)
#>  R6             2.6.1     2025-02-15 [1] CRAN (R 4.6.0)
#>  RColorBrewer   1.1-3     2022-04-03 [1] CRAN (R 4.6.0)
#>  Rcpp           1.1.1-1.1 2026-04-24 [1] CRAN (R 4.6.0)
#>  reprex         2.1.1     2024-07-06 [1] CRAN (R 4.6.0)
#>  rlang          1.2.0     2026-04-06 [1] CRAN (R 4.6.0)
#>  rmarkdown      2.31      2026-03-26 [1] CRAN (R 4.6.0)
#>  rstudioapi     0.18.0    2026-01-16 [1] CRAN (R 4.6.0)
#>  S7             0.2.2     2026-04-22 [1] CRAN (R 4.6.0)
#>  scales         1.4.0     2025-04-24 [1] CRAN (R 4.6.0)
#>  see            0.14.0    2026-05-24 [1] CRAN (R 4.6.0)
#>  sessioninfo    1.2.4     2026-06-04 [1] CRAN (R 4.6.0)
#>  tibble         3.3.1     2026-01-11 [1] CRAN (R 4.6.0)
#>  tidyselect     1.2.1     2024-03-11 [1] CRAN (R 4.6.0)
#>  vctrs          0.7.3     2026-04-11 [1] CRAN (R 4.6.0)
#>  withr          3.0.2     2024-10-28 [1] CRAN (R 4.6.0)
#>  xfun           0.58      2026-06-01 [1] CRAN (R 4.6.0)
#>  xml2           1.5.2     2026-01-17 [1] CRAN (R 4.6.0)
#>  yaml           2.3.12    2025-12-10 [1] CRAN (R 4.6.0)
#>
#>  [1] C:/R/library
#>  [2] C:/R/R-4.6.0/library
#>  * ── Packages attached to the search path.
#>
#> ──────────────────────────────────────────────────────────────────────────────
Dear,
I noticed that the contour lines of the critical Cook's distance function are not changing when the user supplies a new threshold value. The detected outliers in the object and the plot no longer match for different thresholds. The following reprex displays the issue. Can you explain me why that is? Thanks!
Kind regards
Created on 2026-06-22 with reprex v2.1.1
Session info